

Powering Industry: The case for solar in Ghana and Nigeria
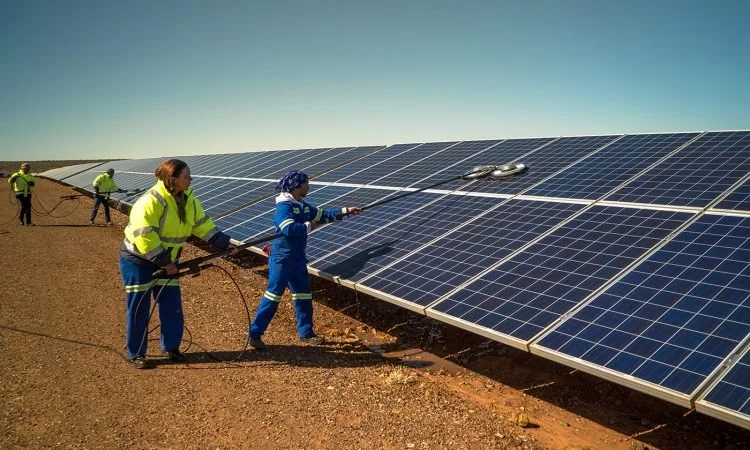
Powering Industry: The case for solar in Ghana and Nigeria
Unreliable electricity remains a major constraint for firms in Ghana and Nigeria. A 2023 World Bank Enterprise Survey found that 73.8% of firms in Ghana experience power outages, compared with 82.5% of firms in Nigeria’s 2025 survey. Ghanaian firms reported an average of 2.9 outages a month, compared with 10.9 in Nigeria, while the median outage lasted one hour in Ghana and three hours in Nigeria. For industries that depend on continuous power, unreliable supply means production losses and a growing reliance on expensive backup generation.
Frequent outages force industrial customers to supplement grid electricity with diesel generators or other captive generation, thereby raising the effective cost of power. Due to geopolitical issues globally, diesel prices have risen to US$1.49 per litre in Ghana and US$1.21 per litre in Nigeria, sharply increasing the cost of self-generation.
Both countries’ grids rely heavily on gas and hydropower for electricity generation. In Ghana, dependable installed capacity is about 5,455 MW, against a peak demand of 4,581 MW, although gas shortages and fluctuations in hydropower availability can still undermine reliability. Nigeria faces a much larger gap between demand and available supply: peak demand is estimated at 20 GW, while only around 4.3 GW of generation capacity was available in April 2026.
However, the incentives differ between the two countries. In Ghana, relatively high tariffs, combined with unreliable supply, strengthen the case for alternatives. In Nigeria, where headline grid tariffs are lower and partly subsidised, unreliable supply is the bigger driver.
Different issues, same solution
Ghana's special load tariffs for high-consuming customers are, on average, about 13% higher than Nigeria's. The comparison needs some qualification: Nigeria's tariffs remain partly subsidised and are therefore not fully cost-reflective. Nigeria uses a service-based system that groups customers into Bands A through E based on how many hours of power they are guaranteed each day. Band A is the top tier, promising at least 20 hours of electricity.
In practice, frequent and unpredictable power cuts can mean that firms do not receive the level of supply implied by their tariff band. This means Nigerian firms rely more on diesel generators than Ghanaians, raising the effective cost of electricity. 28% of Ghanaian firms own or share a diesel generator, compared with 86.3% of Nigerian firms.
In Ghana, between January 2025 and July 2026, cumulative electricity tariffs have increased by 26.82%. The increases have been attributed to higher fuel costs and efforts to recover utility losses. More than 60% of Ghana's electricity generation is thermal, leaving electricity prices exposed to changes in fuel costs.
Following the July 2026 tariff increase, electricity prices for Ghanaian industrial customers range from US$0.12/kWh to $0.21/kWh, plus a fixed monthly charge of US$43.86. Table 1 compares these tariffs with Nigeria's Band A Maximum Demand 2 tariff for an industrial customer consuming 50,000 kWh a month.
Table 1: Industrial Electricity Tariffs and Monthly Power Costs in Ghana and Nigeria
| Tariff category | Tariff (US$/kWh)1 | Service charge (US$/month) | Total monthly cost assuming 50,000 kWh (US$) |
|---|---|---|---|
| Ghana | |||
| SLT-LV | 0.21 | 43.86 | 10,579 |
| SLT-MV | 0.18 | 43.86 | 9,194 |
| SLT-MV2 | 0.12 | 43.86 | 6,037 |
| SLT-HV | 0.17 | 43.86 | 8,310 |
| Nigeria | |||
| Band A MD2 (Industrial) | 0.15 | — | 7,811 |
However, diesel use demonstrates that firms are willing to pay a premium for reliable power. At GHS17.12/L (US$1.49/L), diesel generation costs about US$0.45/kWh in fuel alone, assuming fuel consumption of 0.30 litres/kWh. In contrast, Ghana's highest industrial grid tariff is about US$0.21/kWh.
Captive gas can also play a role, particularly for larger Nigerian industrial facilities, but it remains exposed to fuel prices, infrastructure constraints and supply reliability.
This creates an increasingly compelling economic case for solar.
The case for solar
Solar requires a higher upfront investment than relying on the grid or diesel generation, but has little exposure to fuel prices. Still, solar alone is unlikely to replace the grid or diesel for industries that require continuous power. For many facilities, the more realistic model is a hybrid system combining solar PV, batteries, the grid and a diesel generator. Solar can meet daytime demand, batteries can shift some of that power into the evening, while diesel or the grid provides backup when solar output is low or demand is high. The economics therefore depend on a facility's load profile and storage needs, not simply on the share of electricity supplied by solar.
An illustrative example shows the potential savings. Consider a small industrial facility operating 12 hours a day, 26 days a month, with an average load of 12 kW. A 35 kWp solar system paired with a 60 kWh battery, costing about US$54,839, could supply 75% of its annual electricity demand. At current diesel prices, the system would significantly reduce fuel consumption in both countries.
Table 2: Illustrative economics of a solar-battery system
| ILLUSTRATIVE INDUSTRIAL SITE | NIGERIA | GHANA |
|---|---|---|
| Annual electricity use | 44,928 kWh | 44,928 kWh |
| Share supplied by solar | 75% | 75% |
| Share supplied by diesel | 25% | 25% |
| Diesel use without solar | 19,469 L/year | 19,469 L/year |
| Diesel cost without solar2 | $21,353 | $28,366 |
| Diesel use with solar | 4,860 L/year | 4,860 L/year |
| Diesel cost with solar (B) | $5,330 | $7,081 |
| Annual fuel savings from solar (A − B) | $16,023 | $21,285 |
| Solar system cost | $54,839 | $54,839 |
| Simple solar payback period3 | 3.4 years | 2.6 years |
This system cuts annual diesel fuel costs by about 75%, from US$21,353 to US$5,330 in Nigeria and from US$28,366 to US$7,081 in Ghana. On a simple fuel-only calculation, the US$54,839 investment would pay for itself in about 3.4 years in Nigeria and 2.6 years in Ghana. Actual payback would vary with equipment costs, financing, solar irradiation, load profiles and battery requirements.
Solar’s advantage is not that it eliminates the need for other off-grid generation systems, but that it can displace the most expensive portion of that generation while reducing exposure to fuel-price volatility.
Barriers and policy solutions
The bigger barrier is not necessarily the economics but the upfront investment cost. A US$54,839 investment is significant for a small industrial facility, even when the system can pay for itself in less than four years. This matters in markets where commercial borrowing costs are high and businesses already face competing demands for working capital. Commercial and industrial solar providers are responding with financing models that reduce the upfront burden. In Ghana, leasing allows customers to pay over time, while Nigerian providers increasingly offer tariff-based and pay-as-you-go models that shift the cost from upfront capital expenditure to ongoing payments.
Both countries are also strengthening the policy environment for commercial and industrial solar. Ghana has rolled out net metering, allowing solar users to export surplus electricity to the grid for bill credits. Nigeria introduced net billing regulations in 2026, allowing eligible 50 kW–1.5 MW commercial and industrial systems to export surplus electricity to distribution companies at an approved tariff and receive credits. The impact of the new rules will depend on implementation.
Demand for industrial solar is already growing. Ghana's solar market is projected to expand through 2031, with the commercial and industrial segment growing faster than the wider market. In Nigeria, BloombergNEF estimates that decentralised solar capacity reached about 6 GW by 2025, roughly 44% of the country's installed grid capacity. Much of this capacity sits outside the national grid, reflecting how businesses and households are already responding to unreliable supply.
The government's role should be to create a predictable environment for investment, including clearer implementation of incentives and fewer barriers to importing solar equipment. In Ghana, import duties, VAT and regulatory levies can increase the cost of solar components. Nigeria faces a different policy dilemma: proposals to restrict solar panel imports in favour of local manufacturing risk increasing costs before a domestic industry is ready to supply reliable, affordable equipment. At the same time, greater investment in utility-scale solar could help reduce electricity costs across the wider system.
Conclusion
Solar will not, by itself, make West African industry competitive. Electricity is only one part of industrial costs, alongside labour, transport, imported inputs, finance and logistics. But the evidence suggests solar can reduce two significant power constraints: the high cost of diesel and unreliable grid supply. The strongest case comes when solar is paired with storage and used to displace diesel generation. Financing will determine whether businesses can capture those savings. In Nigeria, the immediate value is greater reliability and lower diesel use. In Ghana, higher tariffs add a stronger cost-saving incentive.
Subscribe to our newsletter below and stay informed on the latest updates, engagements, and news!
